We're thrilled to announce that Polinode 2.0 has recently gone live. This is the latest evolution in the Polinode Organizational Network Analysis platform and brings a host of highly requested features to all of our existing users. We're excited to unveil these enhancements, each designed to make your network analysis experience more intuitive, powerful, and efficient. Below, we provide a summary of the top ten new features that have just gone live.
1. Everything is Now a Module
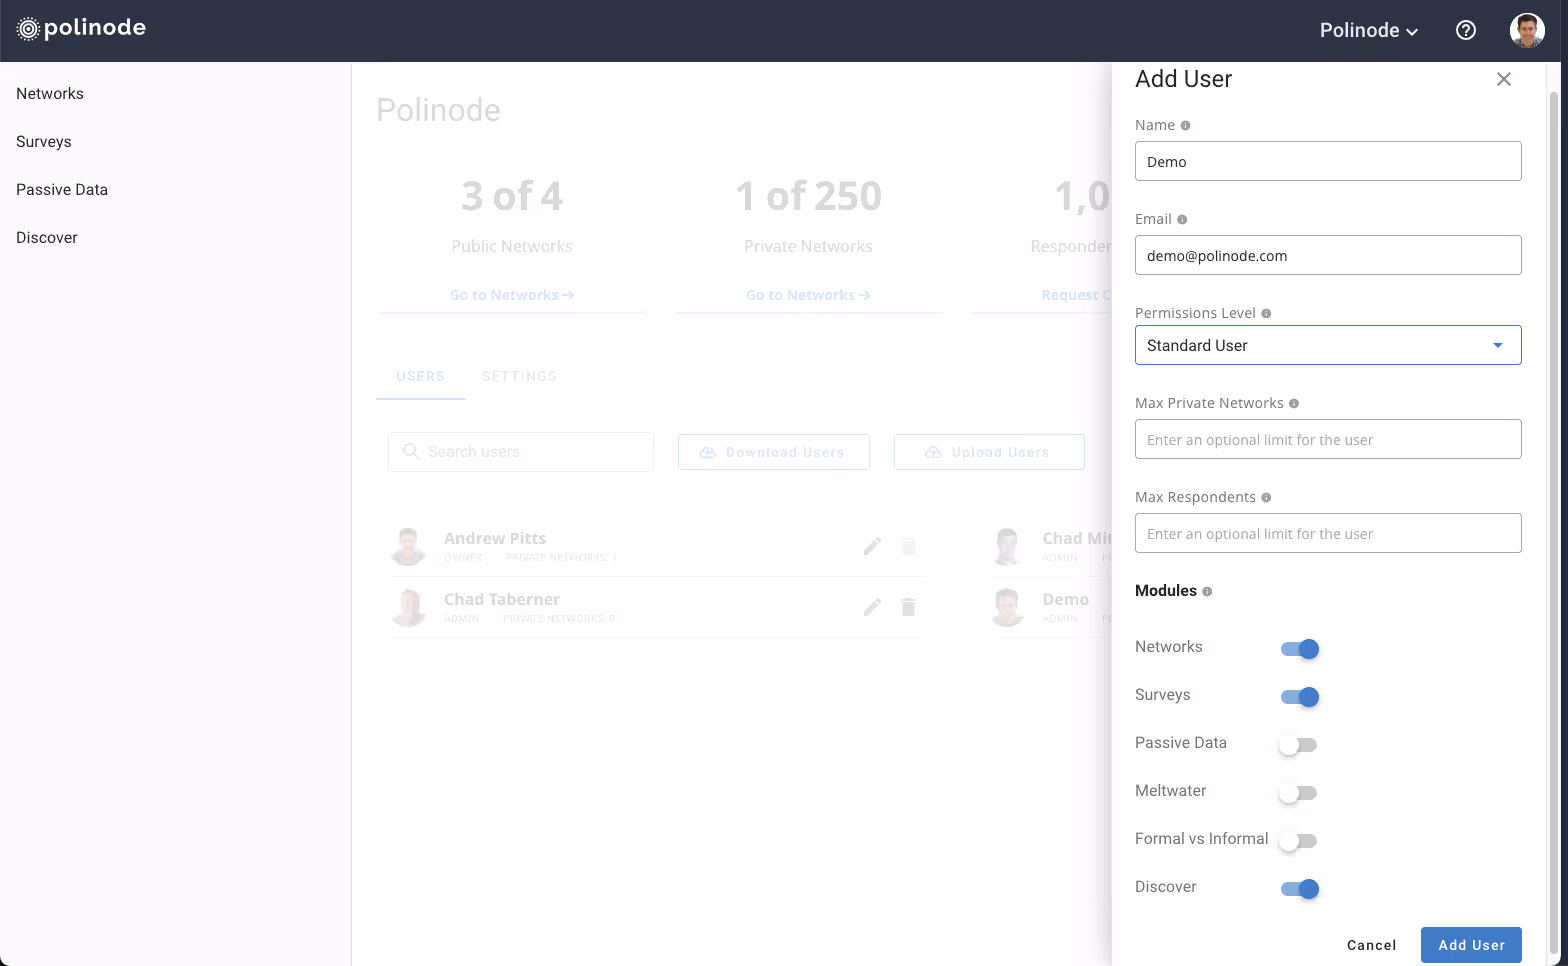
One of the most significant changes in Polinode 2.0 is that everything is now a module. Unlike in the previous version where all users had access to Networks and Surveys and additional features were grouped under the Add-Ons tab, in Polinode 2.0, everything is now categorized as a module. Networks is its own module, Surveys is its own module, Passive Data is its own module and so on. This modular approach provides organizations with greater flexibility and control over what functionality is turned on both for the whole organization and for individual users.
Organizations can now tailor access permissions for each module separately. This means that administrators can grant or restrict access to specific functionalities based on user roles or organizational needs. For example, one user may have access only to the Surveys module, while another user may have access to both Networks and Surveys.
We are excited about the possibilities that this new module structure opens up and have already started working on some additional modules that we will be adding to the platform.
2. Give Access to People Outside of Your Organization
Polinode 2.0 also introduces a game-changing feature that allows users to grant access to their networks or surveys to other Polinode users outside of their organization. This greatly expands the collaboration possibilities. In previous versions, we restricted the ability of users so that they could only share access to their networks and surveys with other users in their own organization. However, with the introduction of external access permissions, users now have the flexibility to invite individuals outside of their organization to collaborate on specific projects or view designated network data. For example, a consultant using Polinode can now share access to networks (including saved views) with their client in a different organizational account.

Information security and privacy is of course something that we place a great deal of importance on here at Polinode and so it should be no surprise that, in introducing this new feature, we have also given organizational admins the ability to turn it off. That is to say, it’s easy for an admin user to navigate to the settings for their organization and turn off the ability to share access to networks and surveys outside of their own organization. Such an admin user could even turn the feature on temporarily while such access was granted and then turn it off afterwards.
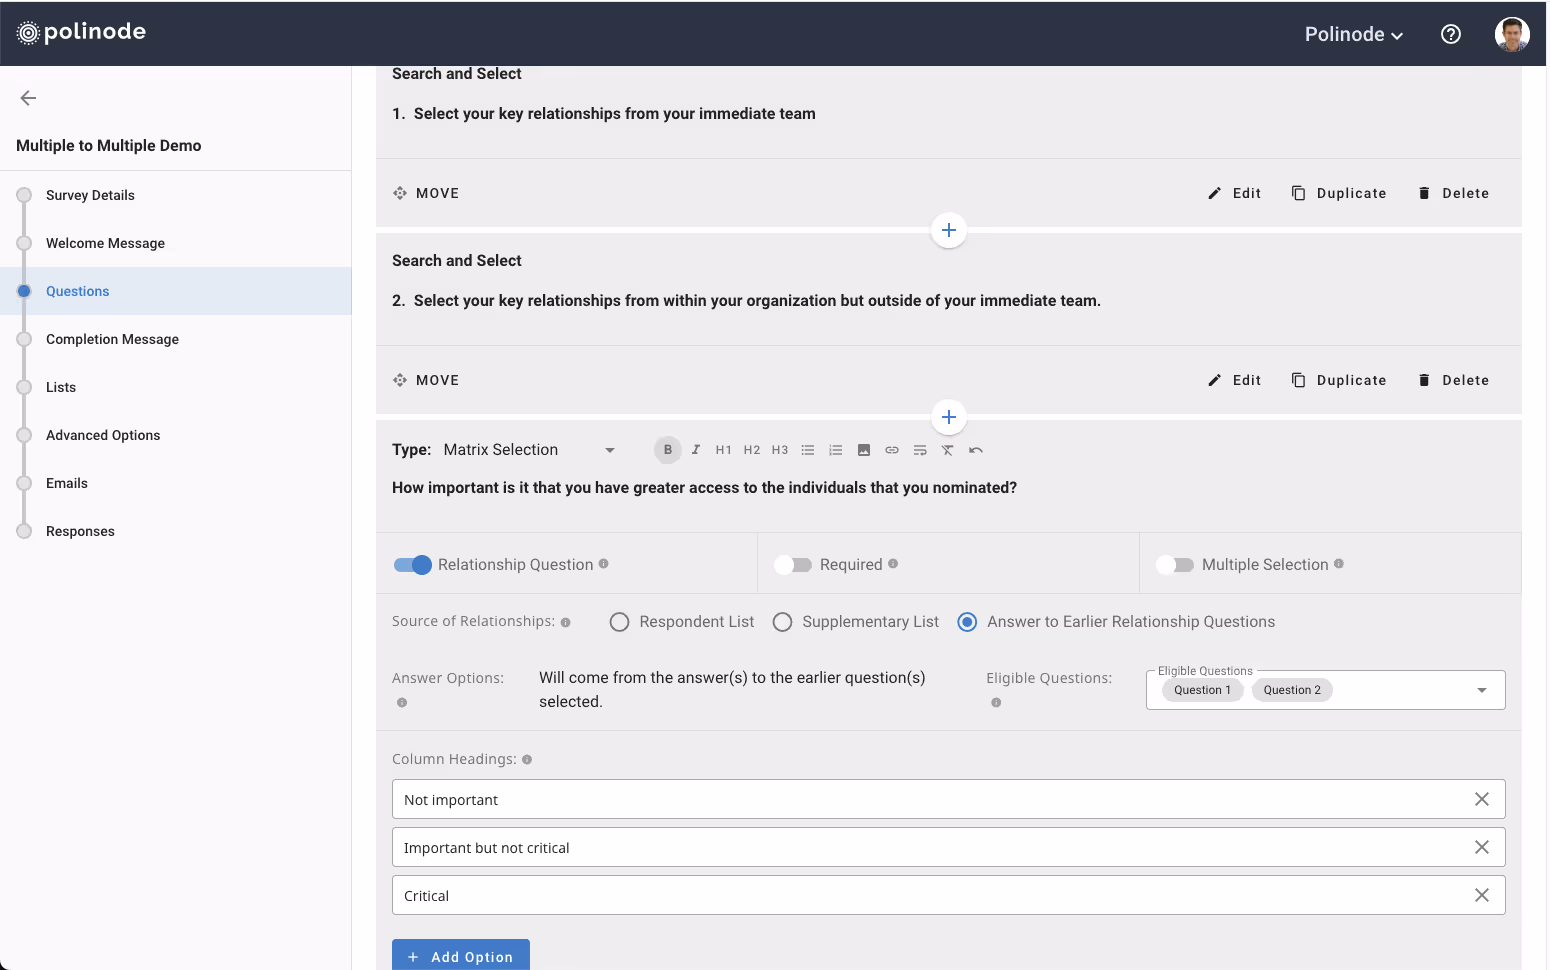
3. Pipe from Multiple Questions to Multiple Questions
It is now possible to pipe from multiple questions into multiple questions within surveys. This new feature streamlines the survey creation process and offers greater flexibility in capturing and analyzing respondent data.
For example, suppose a survey includes two Search and Select questions. The first one prompts respondents to identify key relationships within their immediate team and the second one asks them to identify key relationships within the broader organization. In the previous version of Polinode, users needed to pipe the responses from each of those Search and Select questions separately into a set of follow-up questions. However, with the new question piping functionality in Polinode 2.0, users can combine the responses from both questions and pipe those combined responses into a set of subsequent questions.
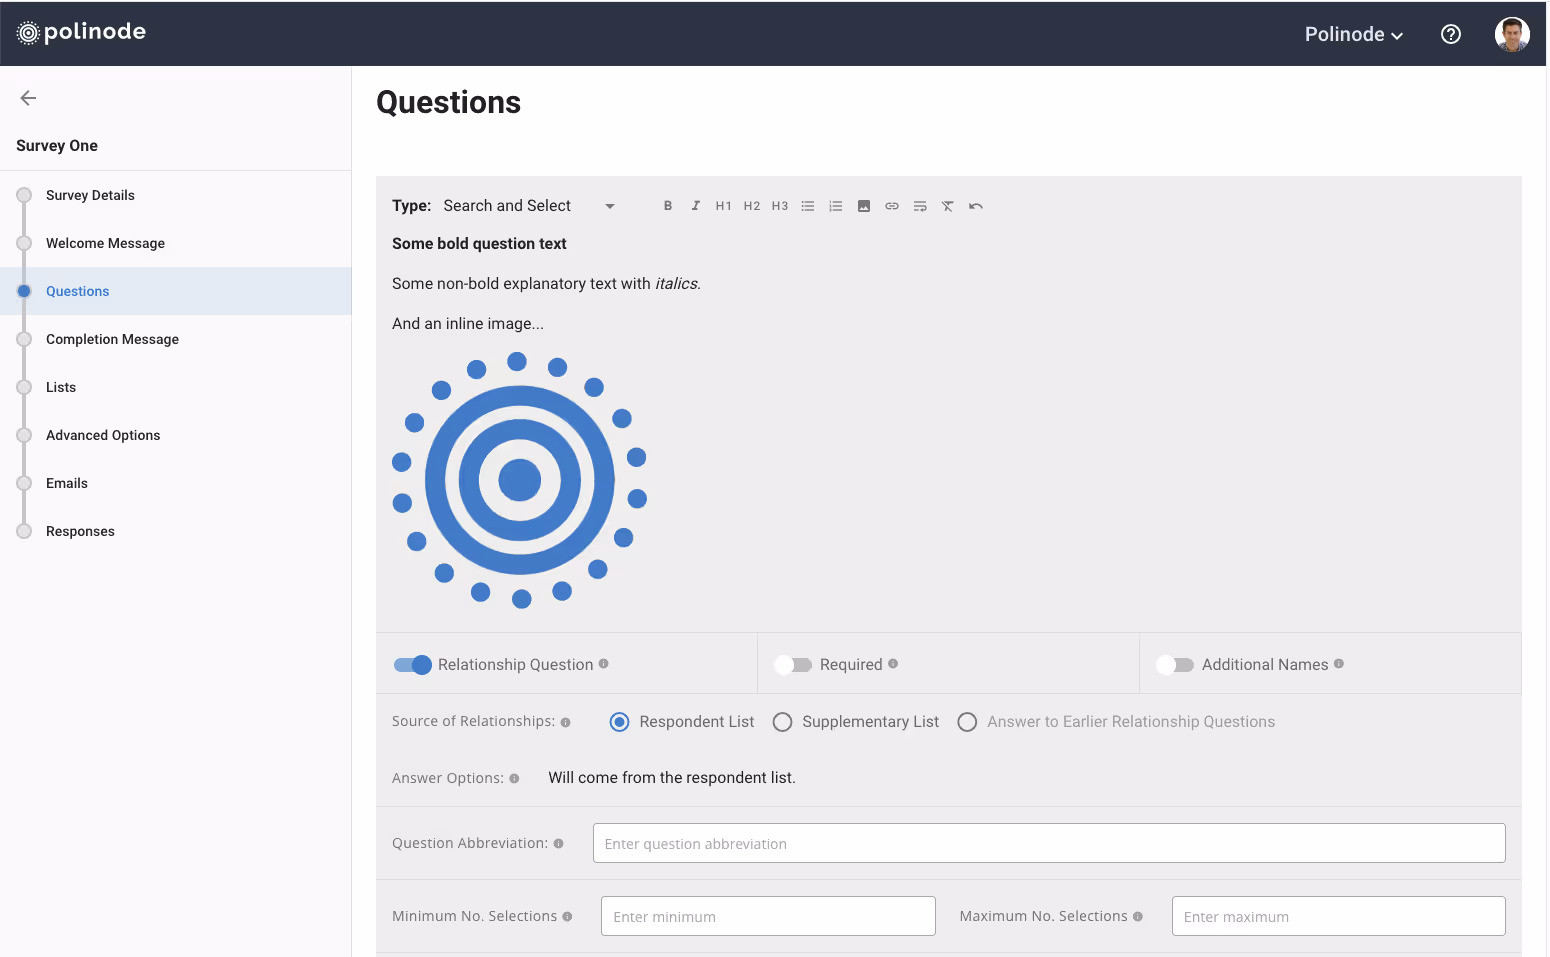
4. Rich Text Replaces Markdown
In Polinode 2.0, the transition from markdown to rich text marks a significant improvement in the platform's usability and relationship-based survey creation capabilities. Previously, users were restricted to using markdown when they wanted to add formatting such as bold text, italics or even images to survey question text, welcome messages and so on. We heard the feedback from users that said that they didn’t find markdown easy to use and have introduced rich text formatting. Users now have access to a wider array of styling options and formatting features through the richt text menu bar. It’s possible to add images, bold text, italics, lists, links and so on all with the click of a button.
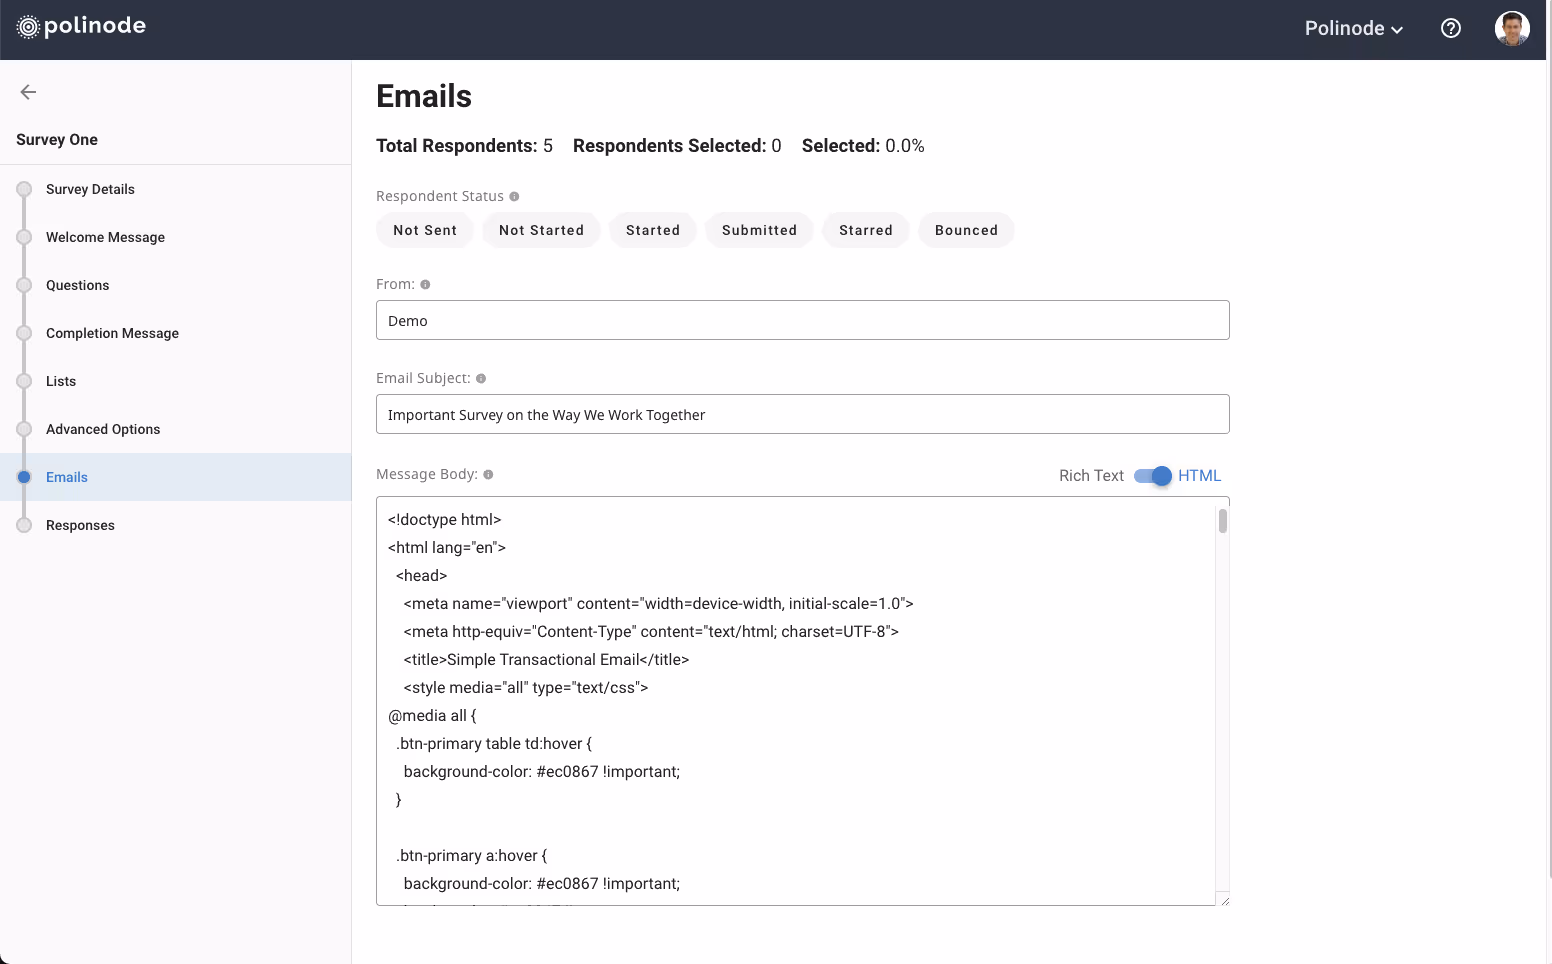
5. Write Custom HTML Emails for Distribution
In addition to rich text functionality, Polinode 2.0 also introduces the ability to create custom HTML emails for survey distribution. This gives users the ability to have much more control of the way their surveys are distributed. It’s possible to toggle between rich text and HTML modes when composing emails to send to survey respondents so if you are looking to compose something quickly you can use the rich text option. But, if you would like to send a custom formatted email with your own template including your own logo and color theme, it’s now possible to do so.
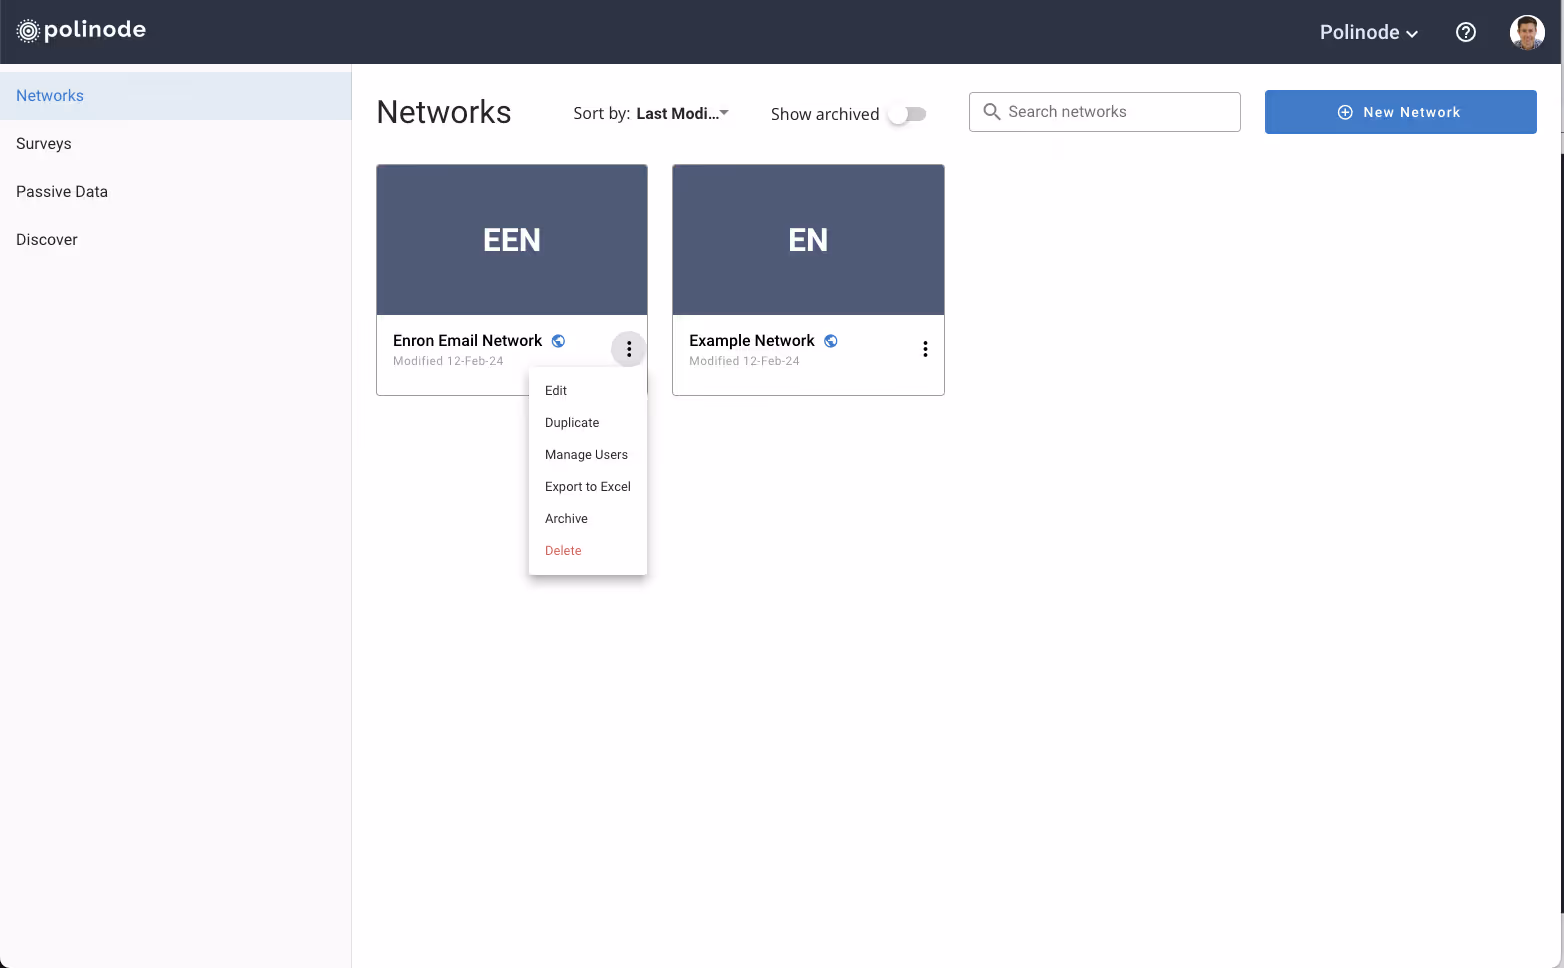
6. Clone and Archive Networks
The next new feature in Polinode 2.0 we’ll cover is the ability to clone and archive networks. In Polinode 1.0, users could clone and archive surveys, but this functionality was not extended to networks. With Polinode 2.0, users now have the ability to clone and archive networks.
The new feature allows users to quickly duplicate existing networks for experimentation and testing purposes without affecting the original network. This cloning capability is particularly useful for users who want to explore different data configurations or conduct separate analyses without altering their primary network. By providing a safe environment for testing, users can iterate more efficiently and confidently in their network analysis endeavors. When you clone a network all of the views of that network will also be immediately cloned and available in the new network you have just created.
Additionally, the ability to archive networks offers users a way to declutter their workspace and focus on active projects. Users can easily toggle the "Show archived" button (see image below) to view archived networks and quickly identify them by the accompanying label. Archiving networks provides a convenient way to maintain previous projects for reference or historical purposes while keeping the workspace organized and streamlined for ongoing work.
7. Toggle Layers On and Off
Polinode 2.0 also provides a much requested feature relating to layers in a network view - users now have the ability to toggle individual layers on and off. In Polinode, visualizations are built using layers, where each layer represents a specific action applied to the network, such as filtering nodes or adjusting node sizes based on a particular attribute. These layers are sequentially applied, with each subsequent layer building upon the previous one to create the final visualization. With the new toggle feature, users now have the ability to selectively enable or disable individual layers within their visualizations. This functionality was not available in Polinode 1.0 and provides users with greater flexibility and control when exploring their network data.

8. Collaboration and Membership Matrices as Layouts in a View
In Polinode 2.0, users can now save collaboration and membership matrices as views. Views serve as containers for specific visualization choices, allowing users to capture configurations such as sizing nodes by total connections and coloring them by department. This feature empowers users to organize and retain multiple visualizations for a single network, fostering efficient analysis and exploration. Each network can have up to 50 different views (well by default that is, we can add the ability to save more views if needed).
Previously the collaboration matrix was accessed under Reports in Polinode but we’ve now added it under Layouts so that it’s possible to save as a view. We’ve also introduced additional functionality like an integrated heatmap with configurable colors. In addition to collaboration matrices, we’ve introduced membership matrices that are also available under layouts and also able to be saved as part of a view. Now you can quickly and easily see which teams / functions / divisions are in which informal community natively inside Polinode!

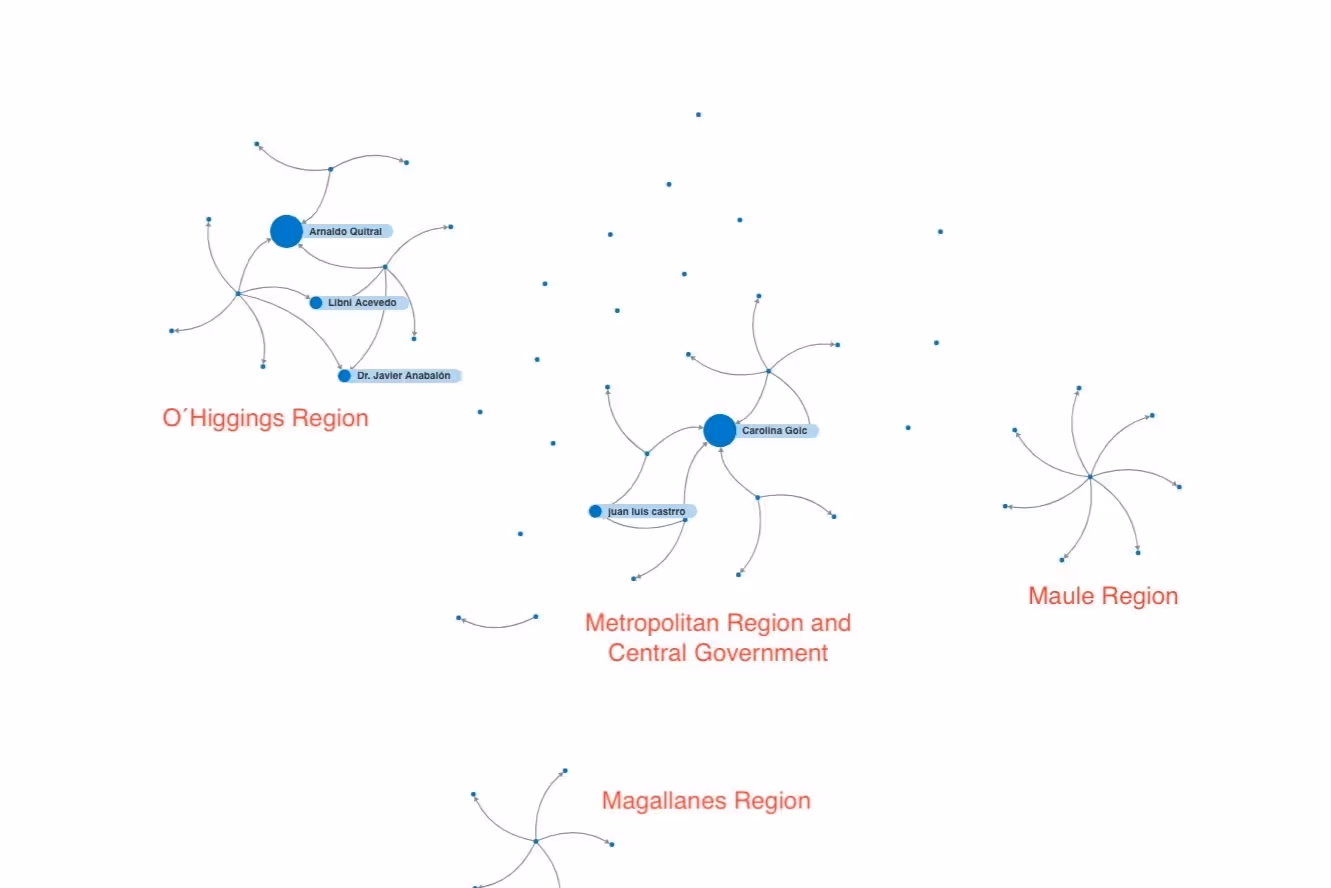
9. New Powerful Org Layout / Tree Layout
In addition to the Collaboration and Membership Matrix functionality that can be found under Layouts In Polinode 2.0, users also now have access to a new powerful Org Chart / Tree Layout. Users can now upload organizational chart data directly to Polinode and apply the Org Chart / Tree Layout to visualize formal organizational charts as a network, given the data follows a hierarchical or tree-like structure. In this way, it’s now possible to view and analyze the formal network alongside the informal network. For example, you can color or size the Org Chart by informal metrics such as communities or measures of centrality.
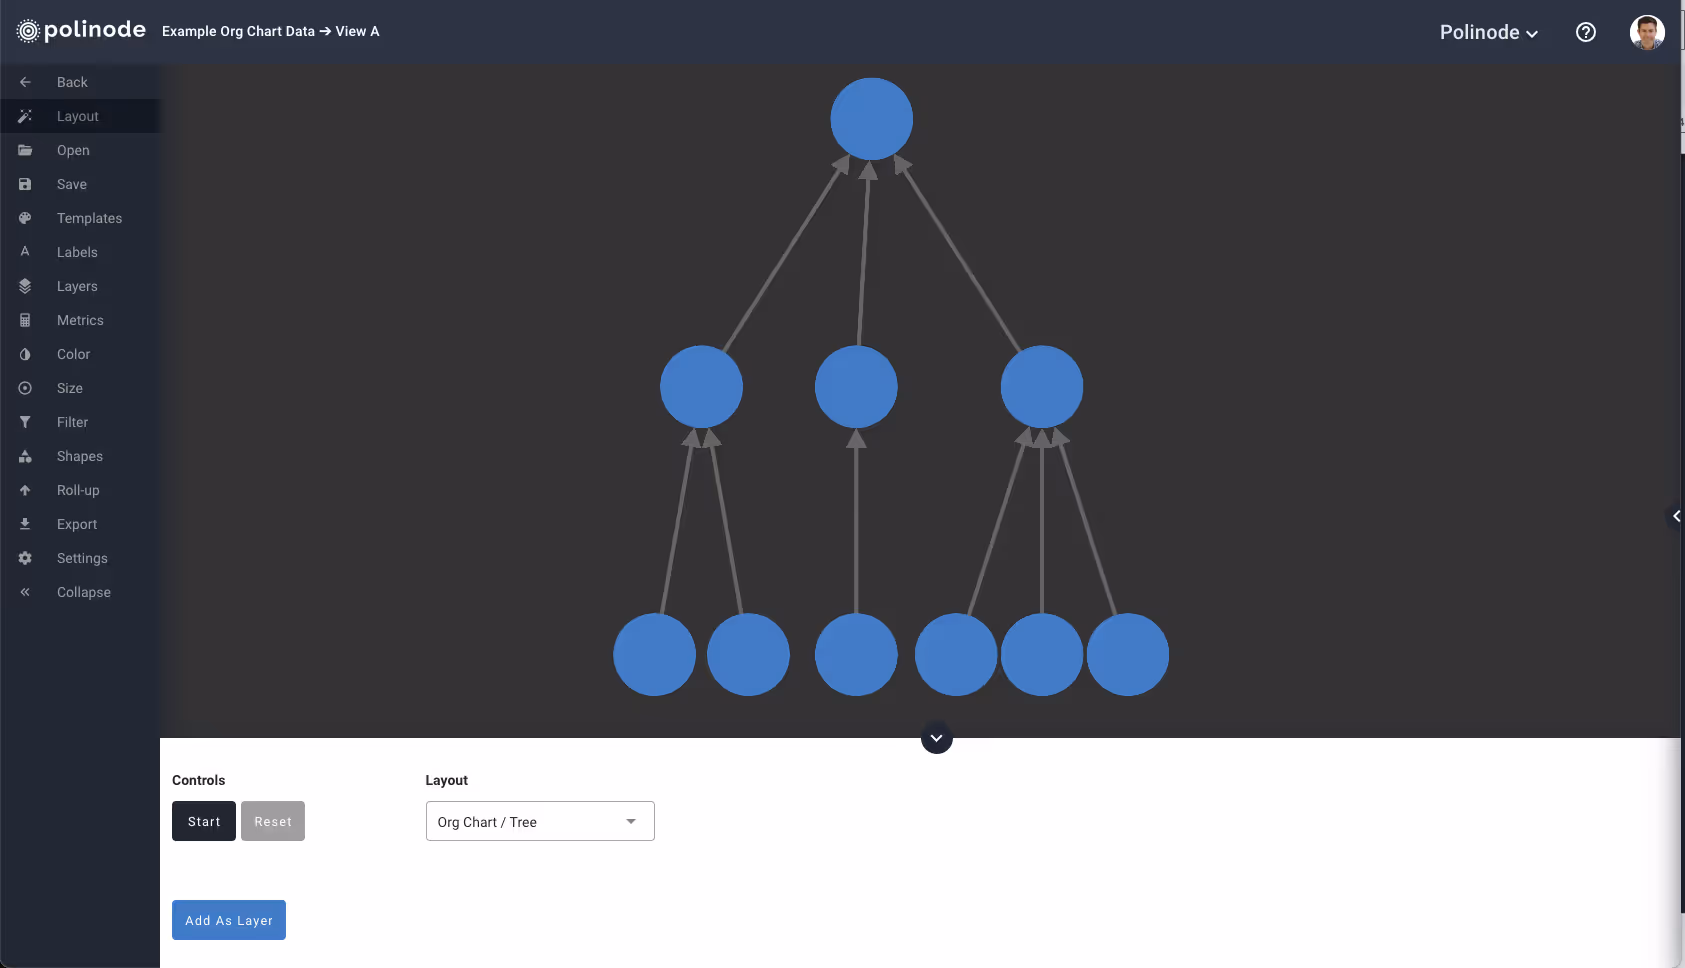
This capability opens up new avenues for exploring organizational dynamics and understanding the relationships between formal hierarchies and informal networks within the organization.
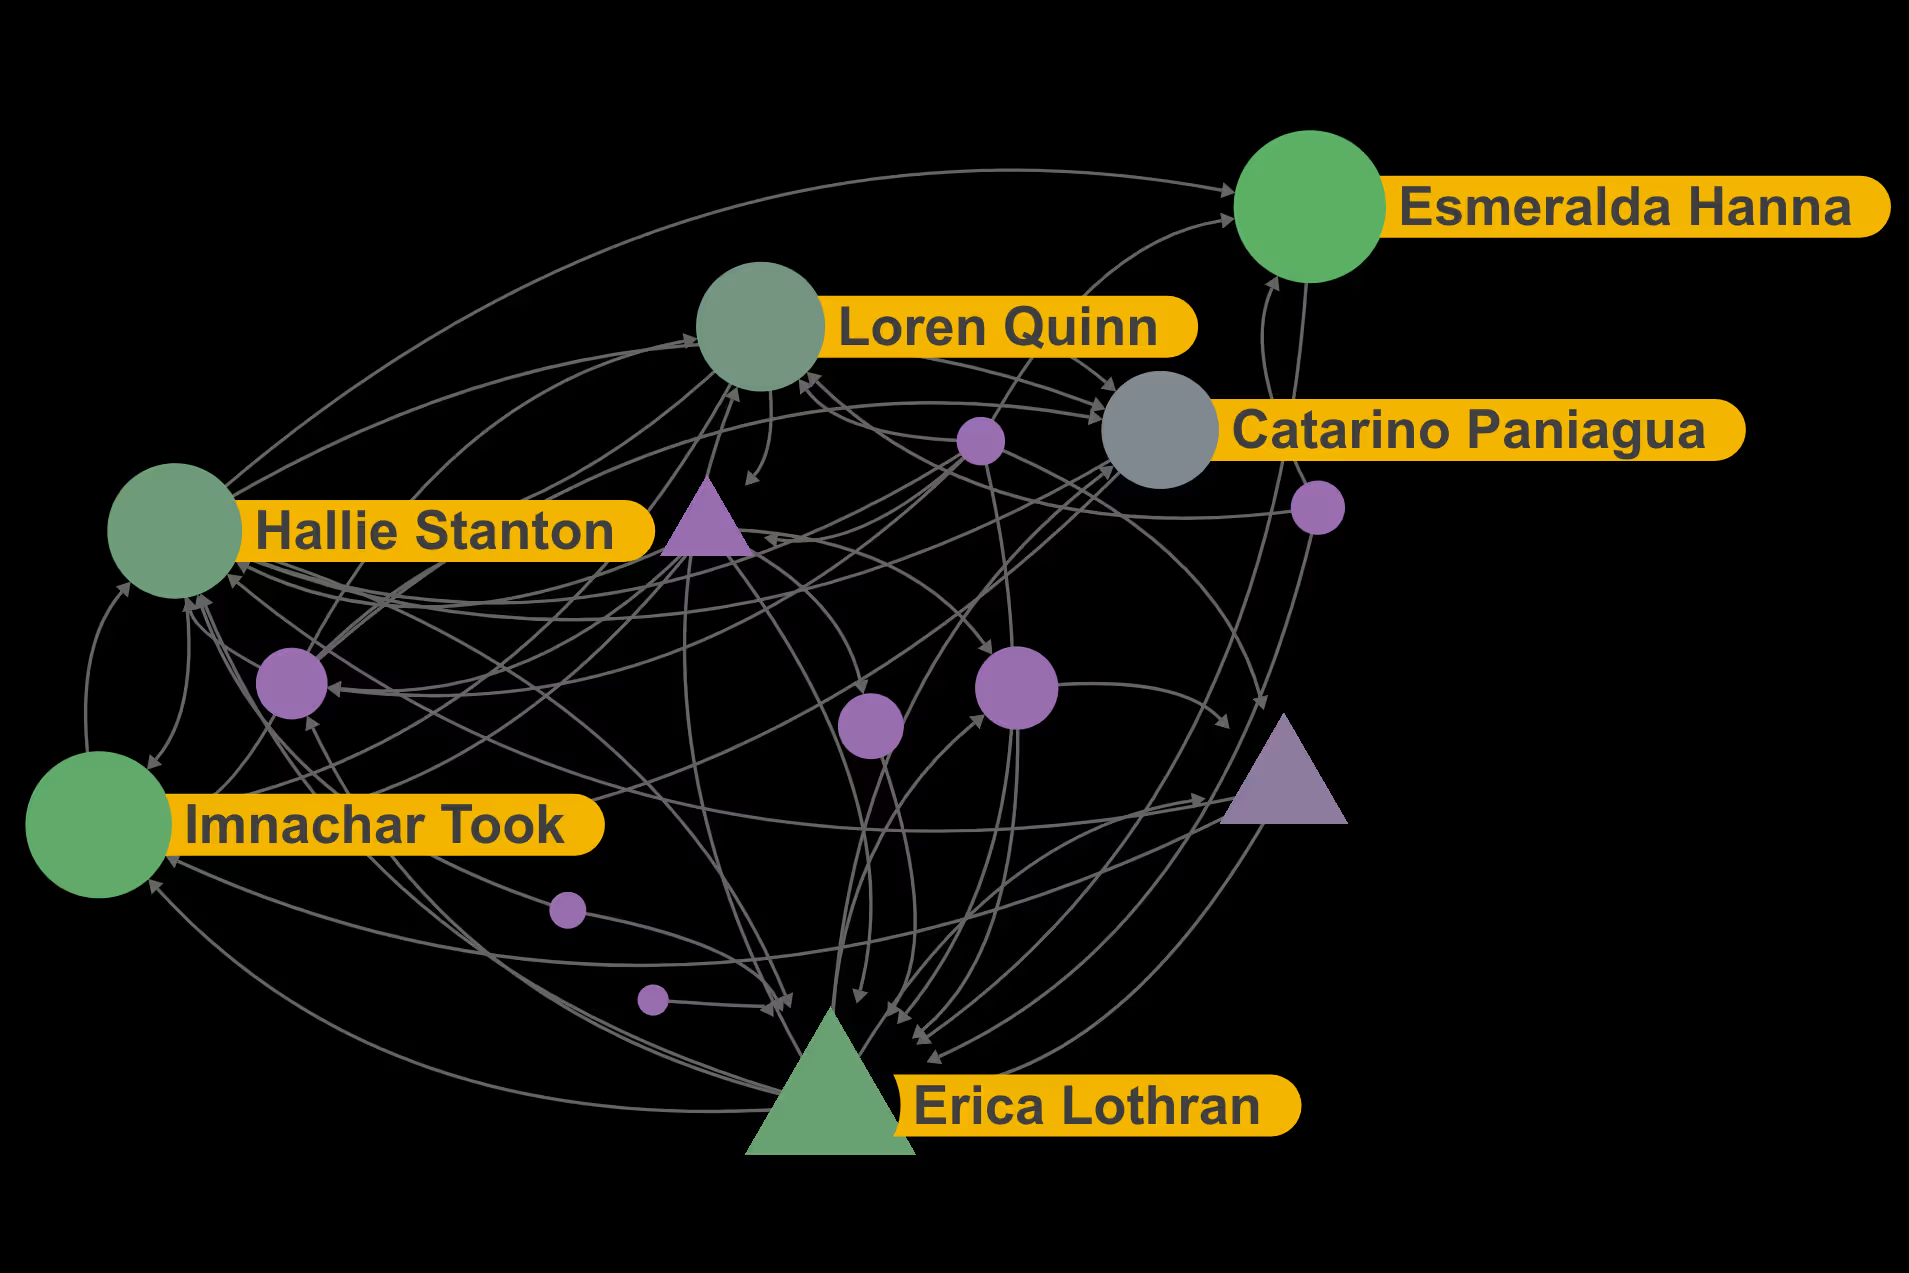
10. Set Shapes Interactively by an Attribute
The next new feature we'll explore in Polinode 2.0 is the ability to set shapes interactively based on specific attributes, such as gender or organizational level. This feature enhances the clarity and interpretability of network diagrams, offering users a flexible way to represent different categories within their networks. For example, users could represent CEOs, VPs, and Directors as triangles, squares, and circles, respectively.
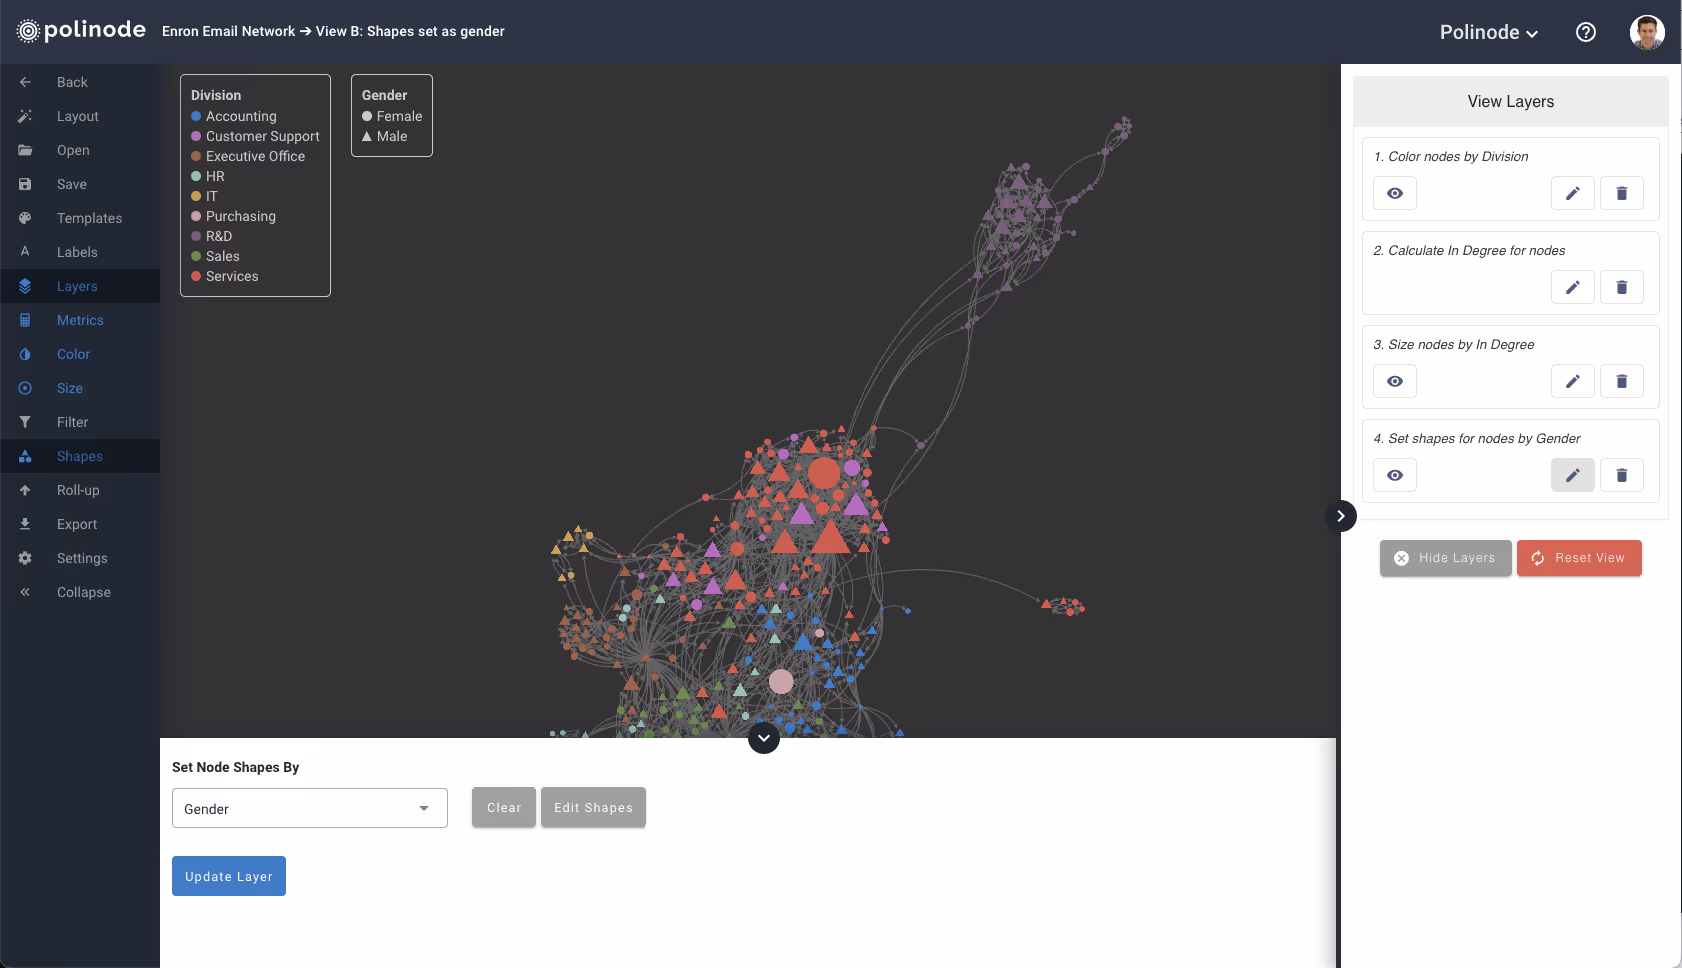
Setting node shapes by a node attribute is of course an operation that can be saved as a layer in any view as you see in the screenshot above.
Conclusion
Polinode 2.0 introduces a number of new features that make the Polinode network analysis even more powerful and help (a) collect relationship data more easily and (b) move from data to insight faster. Importantly the above is not a list of all of the new features, we’ve also added things like support for hashtags in network attributes so you can, for example, add a list of skills to any one individual in the network and then filter by one or more of those skills.
We would like to thank all of the Polinode users over the last few years who have provided us with the feedback to keep improving the platform and especially the small group of beta users who engaged with us to help bring Polinode 2.0 to life. We are very excited about everything that is new in Polinode 2.0 but we are even more excited to continue building on the platform and delivering everything that you need for powerful yet easy-to-use network analysis.
If you would like a demo of the new features and/or the Polinode platform generally, please get in touch with us by emailing info@polinode.com or filling in this form.

Andrew Pitts

Andrew Pitts is the Founder and CEO of Polinode, a leading provider of organisational network analysis software and solutions for enterprises. Andrew founded Polinode in 2013 and it is now used by large enterprises and consulting partners around the world for a variety of applications including: identifying emerging and/or hidden talent; improving collaboration; finding influencers; succession planning; organisational design; and diversity and inclusion. Prior to founding Polinode, Andrew worked in the Investment Banking Division of Goldman Sachs in both Sydney and New York. He enjoys working at the intersection of technology and HR and is passionate about using technology to help optimise and improve modern organisations. Andrew is a full-stack developer with experience building scalable web applications and also has deep expertise in data analysis and machine learning.